Maintennance
Maintennance
Explain/Explain Analyze Statements
The purpose of query analysis is to assist users in understanding the execution mechanism and performance bottlenecks of queries, thereby facilitating query optimization and performance enhancement. This is crucial not only for the efficiency of query execution but also for the user experience of applications and the efficient utilization of resources. For effective query analysis, IoTDB versions V1.3.2 and above offer the query analysis statements: Explain and Explain Analyze.
Explain Statement: The Explain statement allows users to preview the execution plan of a query SQL, including how IoTDB organizes data retrieval and processing.
Explain Analyze Statement: The Explain Analyze statement builds upon the Explain statement by incorporating performance analysis, fully executing the SQL, and displaying the time and resource consumption during the query execution process. This provides IoTDB users with detailed information to deeply understand the details of the query and to perform query optimization. Compared to other common IoTDB troubleshooting methods, Explain Analyze imposes no deployment burden and can analyze a single SQL statement, which can better pinpoint issues.
The comparison of various methods is as follows:
| Method | Installation Difficulty | Business Impact | Functional Scope |
|---|---|---|---|
| Explain Analyze Statement | Low. No additional components are needed; it's a built-in SQL statement of IoTDB. | Low. It only affects the single query being analyzed, with no impact on other online loads. | Supports distributed systems, and can track a single SQL statement. |
| Monitoring Panel | Medium. Requires the installation of the IoTDB monitoring panel tool (an enterprise version tool) and the activation of the IoTDB monitoring service. | Medium. The IoTDB monitoring service's recording of metrics will introduce additional latency. | Supports distributed systems, but only analyzes the overall query load and time consumption of the database. |
| Arthas Sampling | Medium. Requires the installation of the Java Arthas tool (Arthas cannot be directly installed in some intranets, and sometimes a restart of the application is needed after installation). | High. CPU sampling may affect the response speed of online business. | Does not support distributed systems and only analyzes the overall query load and time consumption of the database. |
Explain Statement
Syntax
The Explain command enables users to view the execution plan of a SQL query. The execution plan is presented in the form of operators, describing how IoTDB will execute the query. The syntax is as follows, where SELECT_STATEMENT is the SQL statement related to the query:
EXPLAIN <SELECT_STATEMENT>The results returned by Explain include information such as data access strategies, whether filter conditions are pushed down, and how the query plan is distributed across different nodes, providing users with a means to visualize the internal execution logic of the query.
Example
# Insert data

insert into root.explain.data(timestamp, column1, column2) values(1710494762, "hello", "explain")

# Execute explain statement

explain select * from root.explain.data
Executing the above SQL will yield the following results. It is evident that IoTDB uses two SeriesScan nodes to retrieve the data for column1 and column2, and finally connects them through a fullOuterTimeJoin.
+-----------------------------------------------------------------------+
|                                                      distribution plan|
+-----------------------------------------------------------------------+
|                         ┌───────────────────┐                         |
|                         │FullOuterTimeJoin-3│                         |
|                         │Order: ASC         │                         |
|                         └───────────────────┘                         |
|                 ┌─────────────────┴─────────────────┐                 |
|                 │                                   │                 |
|┌─────────────────────────────────┐ ┌─────────────────────────────────┐|
|│SeriesScan-4                     │ │SeriesScan-5                     │|
|│Series: root.explain.data.column1│ │Series: root.explain.data.column2│|
|│Partition: 3                     │ │Partition: 3                     │|
|└─────────────────────────────────┘ └─────────────────────────────────┘|
+-----------------------------------------------------------------------+
Explain Analyze Statement
Syntax
Explain Analyze is a performance analysis SQL that comes with the IoTDB query engine. Unlike Explain, it executes the corresponding query plan and collects execution information, which can be used to track the specific performance distribution of a query, for observing resources, performance tuning, and anomaly analysis. The syntax is as follows:
EXPLAIN ANALYZE [VERBOSE] <SELECT_STATEMENT>Where SELECT_STATEMENT corresponds to the query statement that needs to be analyzed; VERBOSE prints detailed analysis results, and when VERBOSE is not filled in, EXPLAIN ANALYZE will omit some information.
In the EXPLAIN ANALYZE result set, the following information is included:
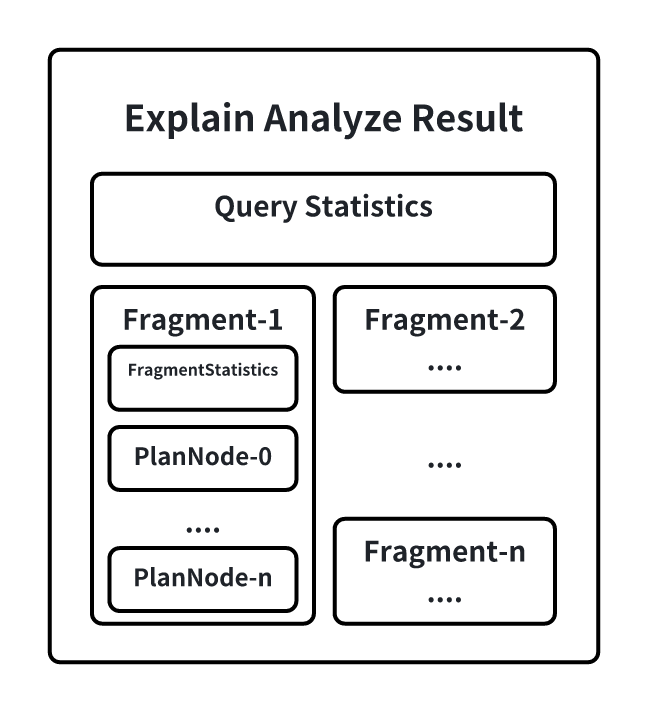
- QueryStatistics contains statistical information at the query level, mainly including the time spent in the planning and parsing phase, Fragment metadata, and other information.
- FragmentInstance is an encapsulation of the query plan on a node by IoTDB. Each node will output a Fragment information in the result set, mainly including FragmentStatistics and operator information. FragmentStatistics contains statistical information of the Fragment, including total actual time (wall time), TsFile involved, scheduling information, etc. At the same time, the statistical information of the plan nodes under this Fragment will be displayed in a hierarchical way of the node tree, mainly including: CPU running time, the number of output data rows, the number of times the specified interface is called, the memory occupied, and the custom information exclusive to the node.
Special Instructions
- Simplification of Explain Analyze Statement Results
Since the Fragment will output all the node information executed in the current node, when a query involves too many series, each node is output, which will cause the result set returned by Explain Analyze to be too large. Therefore, when the same type of node exceeds 10, the system will automatically merge all the same types of nodes under the current Fragment, and the merged statistical information is also accumulated. Some custom information that cannot be merged will be directly discarded (as shown in the figure below).
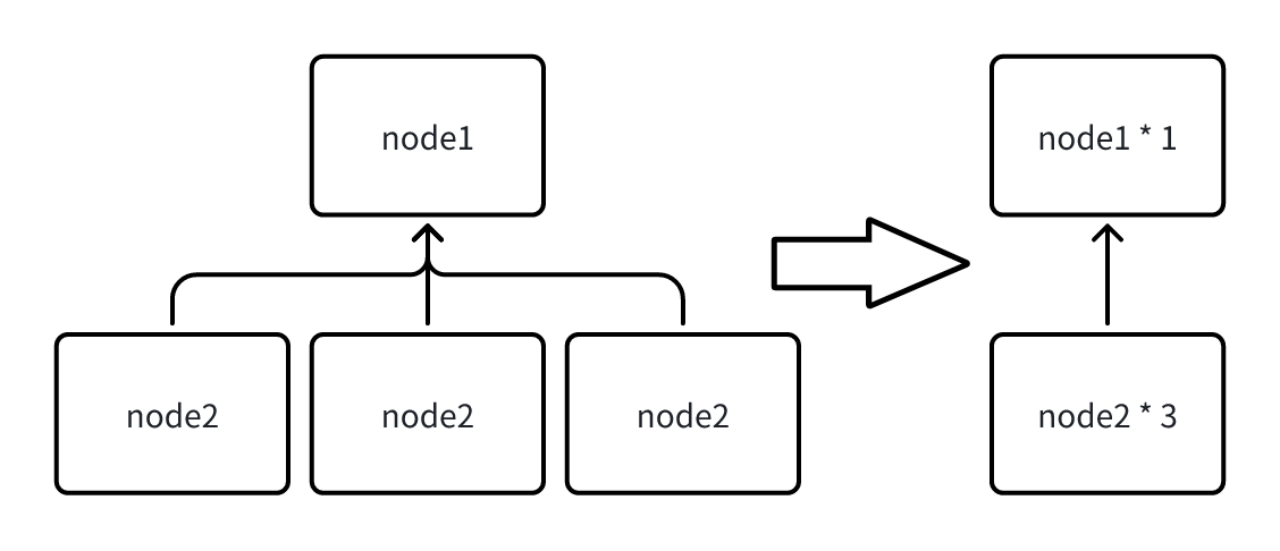
Users can also modify the configuration item merge_threshold_of_explain_analyze in iotdb-system.properties to set the threshold for triggering the merge of nodes. This parameter supports hot loading.
- Use of Explain Analyze Statement in Query Timeout Scenarios
Explain Analyze itself is a special query. When the execution times out, it cannot be analyzed with the Explain Analyze statement. In order to be able to investigate the cause of the timeout through the analysis results even when the query times out, Explain Analyze also provides a timing log mechanism (no user configuration is required), which will output the current results of Explain Analyze in the form of text to a special log at a certain time interval. When the query times out, users can go to logs/log_explain_analyze.log to check the corresponding log for investigation.
The time interval of the log is calculated based on the query timeout time to ensure that at least two result records will be saved before the timeout.
Example
Here is an example of Explain Analyze:
# Insert data

insert into root.explain.analyze.data(timestamp, column1, column2, column3) values(1710494762, "hello", "explain", "analyze")
insert into root.explain.analyze.data(timestamp, column1, column2, column3) values(1710494862, "hello2", "explain2", "analyze2")
insert into root.explain.analyze.data(timestamp, column1, column2, column3) values(1710494962, "hello3", "explain3", "analyze3")

# Execute explain analyze statement

explain analyze select column2 from root.explain.analyze.data order by column1
The output is as follows:
+-------------------------------------------------------------------------------------------------+
|                                                                                  Explain Analyze|
+-------------------------------------------------------------------------------------------------+
|Analyze Cost: 1.739 ms                                                                           |
|Fetch Partition Cost: 0.940 ms                                                                   |
|Fetch Schema Cost: 0.066 ms                                                                      |
|Logical Plan Cost: 0.000 ms                                                                      |
|Logical Optimization Cost: 0.000 ms                                                              |
|Distribution Plan Cost: 0.000 ms                                                                 |
|Fragment Instances Count: 1                                                                      |
|                                                                                                 |
|FRAGMENT-INSTANCE[Id: 20240315_115800_00030_1.2.0][IP: 127.0.0.1][DataRegion: 4][State: FINISHED]|
|  Total Wall Time: 25 ms                                                                         |
|  Cost of initDataQuerySource: 0.175 ms                                                          |
|  Seq File(unclosed): 0, Seq File(closed): 1                                                     |
|  UnSeq File(unclosed): 0, UnSeq File(closed): 0                                                 |
|  ready queued time: 0.280 ms, blocked queued time: 2.456 ms                                     |
|    [PlanNodeId 10]: IdentitySinkNode(IdentitySinkOperator)                                      |
|        CPU Time: 0.780 ms                                                                       |
|        output: 1 rows                                                                           |
|        HasNext() Called Count: 3                                                                |
|        Next() Called Count: 2                                                                   |
|        Estimated Memory Size: : 1245184                                                         |
|      [PlanNodeId 5]: TransformNode(TransformOperator)                                           |
|          CPU Time: 0.764 ms                                                                     |
|          output: 1 rows                                                                         |
|          HasNext() Called Count: 3                                                              |
|          Next() Called Count: 2                                                                 |
|          Estimated Memory Size: : 1245184                                                       |
|        [PlanNodeId 4]: SortNode(SortOperator)                                                   |
|            CPU Time: 0.721 ms                                                                   |
|            output: 1 rows                                                                       |
|            HasNext() Called Count: 3                                                            |
|            Next() Called Count: 2                                                               |
|            sortCost/ns: 1125                                                                    |
|            sortedDataSize: 272                                                                  |
|            prepareCost/ns: 610834                                                               |
|          [PlanNodeId 3]: FullOuterTimeJoinNode(FullOuterTimeJoinOperator)                       |
|              CPU Time: 0.706 ms                                                                 |
|              output: 1 rows                                                                     |
|              HasNext() Called Count: 5                                                          |
|              Next() Called Count: 1                                                             |
|            [PlanNodeId 7]: SeriesScanNode(SeriesScanOperator)                                   |
|                CPU Time: 1.085 ms                                                               |
|                output: 1 rows                                                                   |
|                HasNext() Called Count: 2                                                        |
|                Next() Called Count: 1                                                           |
|                SeriesPath: root.explain.analyze.data.column2                                    |
|            [PlanNodeId 8]: SeriesScanNode(SeriesScanOperator)                                   |
|                CPU Time: 1.091 ms                                                               |
|                output: 1 rows                                                                   |
|                HasNext() Called Count: 2                                                        |
|                Next() Called Count: 1                                                           |
|                SeriesPath: root.explain.analyze.data.column1                                    |
+-------------------------------------------------------------------------------------------------+
Example of Partial Results After Triggering Merge:
Analyze Cost: 143.679 ms
Fetch Partition Cost: 22.023 ms
Fetch Schema Cost: 63.086 ms
Logical Plan Cost: 0.000 ms
Logical Optimization Cost: 0.000 ms
Distribution Plan Cost: 0.000 ms
Fragment Instances Count: 2

FRAGMENT-INSTANCE[Id: 20240311_041502_00001_1.2.0][IP: 192.168.130.9][DataRegion: 14]
  Total Wall Time: 39964 ms
  Cost of initDataQuerySource: 1.834 ms
  Seq File(unclosed): 0, Seq File(closed): 3
  UnSeq File(unclosed): 0, UnSeq File(closed): 0
  ready queued time: 504.334 ms, blocked queued time: 25356.419 ms
    [PlanNodeId 20793]: IdentitySinkNode(IdentitySinkOperator) Count: * 1
        CPU Time: 24440.724 ms
        input: 71216 rows
        HasNext() Called Count: 35963
        Next() Called Count: 35962
        Estimated Memory Size: : 33882112
      [PlanNodeId 10385]: FullOuterTimeJoinNode(FullOuterTimeJoinOperator) Count: * 8
          CPU Time: 41437.708 ms
          input: 243011 rows
          HasNext() Called Count: 41965
          Next() Called Count: 41958
          Estimated Memory Size: : 33882112
        [PlanNodeId 11569]: SeriesScanNode(SeriesScanOperator) Count: * 1340
            CPU Time: 1397.822 ms
            input: 134000 rows
            HasNext() Called Count: 2353
            Next() Called Count: 1340
            Estimated Memory Size: : 32833536
        [PlanNodeId 20778]: ExchangeNode(ExchangeOperator) Count: * 7
            CPU Time: 109.245 ms
            input: 71891 rows
            HasNext() Called Count: 1431
            Next() Called Count: 1431

FRAGMENT-INSTANCE[Id: 20240311_041502_00001_1.3.0][IP: 192.168.130.9][DataRegion: 11]
  Total Wall Time: 39912 ms
  Cost of initDataQuerySource: 15.439 ms
  Seq File(unclosed): 0, Seq File(closed): 2
  UnSeq File(unclosed): 0, UnSeq File(closed): 0
  ready queued time: 152.988 ms, blocked queued time: 37775.356 ms
    [PlanNodeId 20786]: IdentitySinkNode(IdentitySinkOperator) Count: * 1
        CPU Time: 2020.258 ms
        input: 48800 rows
        HasNext() Called Count: 978
        Next() Called Count: 978
        Estimated Memory Size: : 42336256
      [PlanNodeId 20771]: FullOuterTimeJoinNode(FullOuterTimeJoinOperator) Count: * 8
          CPU Time: 5255.307 ms
          input: 195800 rows
          HasNext() Called Count: 2455
          Next() Called Count: 2448
          Estimated Memory Size: : 42336256
        [PlanNodeId 11867]: SeriesScanNode(SeriesScanOperator) Count: * 1680
            CPU Time: 1248.080 ms
            input: 168000 rows
            HasNext() Called Count: 3198
            Next() Called Count: 1680
            Estimated Memory Size: : 41287680

......
Common Issues
What is the difference between WALL TIME and CPU TIME?
CPU time, also known as processor time or CPU usage time, refers to the actual time the CPU is occupied with computation during the execution of a program, indicating the actual consumption of processor resources by the program.
Wall time, also known as real time or physical time, refers to the total time from the start to the end of a program's execution, including all waiting times.
Scenarios where WALL TIME < CPU TIME: For example, a query slice is finally executed in parallel by the scheduler using two threads. In the real physical world, 10 seconds have passed, but the two threads may have occupied two CPU cores and run for 10 seconds each, so the CPU time would be 20 seconds, while the wall time would be 10 seconds.
Scenarios where WALL TIME > CPU TIME: Since there may be multiple queries running in parallel within the system, but the number of execution threads and memory is fixed,
- So when a query slice is blocked by some resources (such as not having enough memory for data transfer or waiting for upstream data), it will be put into the Blocked Queue. At this time, the query slice will not occupy CPU time, but the WALL TIME (real physical time) is still advancing.
- Or when the query thread resources are insufficient, for example, there are currently 16 query threads in total, but there are 20 concurrent query slices within the system. Even if all queries are not blocked, only 16 query slices can run in parallel at the same time, and the other four will be put into the READY QUEUE, waiting to be scheduled for execution. At this time, the query slice will not occupy CPU time, but the WALL TIME (real physical time) is still advancing.
Is there any additional overhead with Explain Analyze, and is the measured time different from when the query is actually executed?
Almost none, because the explain analyze operator is executed by a separate thread to collect the statistical information of the original query, and these statistical information, even if not explain analyze, the original query will also generate, but no one goes to get it. And explain analyze is a pure next traversal of the result set, which will not be printed, so there will be no significant difference from the actual execution time of the original query.
What are the main indicators to focus on for IO time consumption?
The main indicators that may involve IO time consumption are loadTimeSeriesMetadataDiskSeqTime, loadTimeSeriesMetadataDiskUnSeqTime, and construct[NonAligned/Aligned]ChunkReadersDiskTime.
The loading of TimeSeriesMetadata statistics is divided into sequential and unaligned files, but the reading of Chunks is not temporarily separated, but the proportion of sequential and unaligned can be calculated based on the proportion of TimeSeriesMetadata.
Can the impact of unaligned data on query performance be demonstrated with some indicators?
There are mainly two impacts of unaligned data:
An additional merge sort needs to be done in memory (it is generally believed that this time consumption is relatively short, after all, it is a pure memory CPU operation)
Unaligned data will generate overlapping time ranges between data blocks, making statistical information unusable
- Unable to directly skip the entire chunk that does not meet the value filtering requirements using statistical information
- Generally, the user's query only includes time filtering conditions, so there will be no impact
- Unable to directly calculate the aggregate value using statistical information without reading the data
- Unable to directly skip the entire chunk that does not meet the value filtering requirements using statistical information
At present, there is no effective observation method for the performance impact of unaligned data alone, unless a query is executed when there is unaligned data, and then executed again after the unaligned data is merged, in order to compare.
Because even if this part of the unaligned data is entered into the sequence, IO, compression, and decoding are also required. This time cannot be reduced, and it will not be reduced just because the unaligned data has been merged into the unaligned.
Why is there no output in the log_explain_analyze.log when the query times out during the execution of explain analyze?
During the upgrade, only the lib package was replaced, and the conf/logback-datanode.xml was not replaced. It needs to be replaced, and there is no need to restart (the content of this file can be hot loaded). After waiting for about 1 minute, re-execute explain analyze verbose.
Practical Case Studies
Case Study 1: The query involves too many files, and disk IO becomes a bottleneck, causing the query speed to slow down.
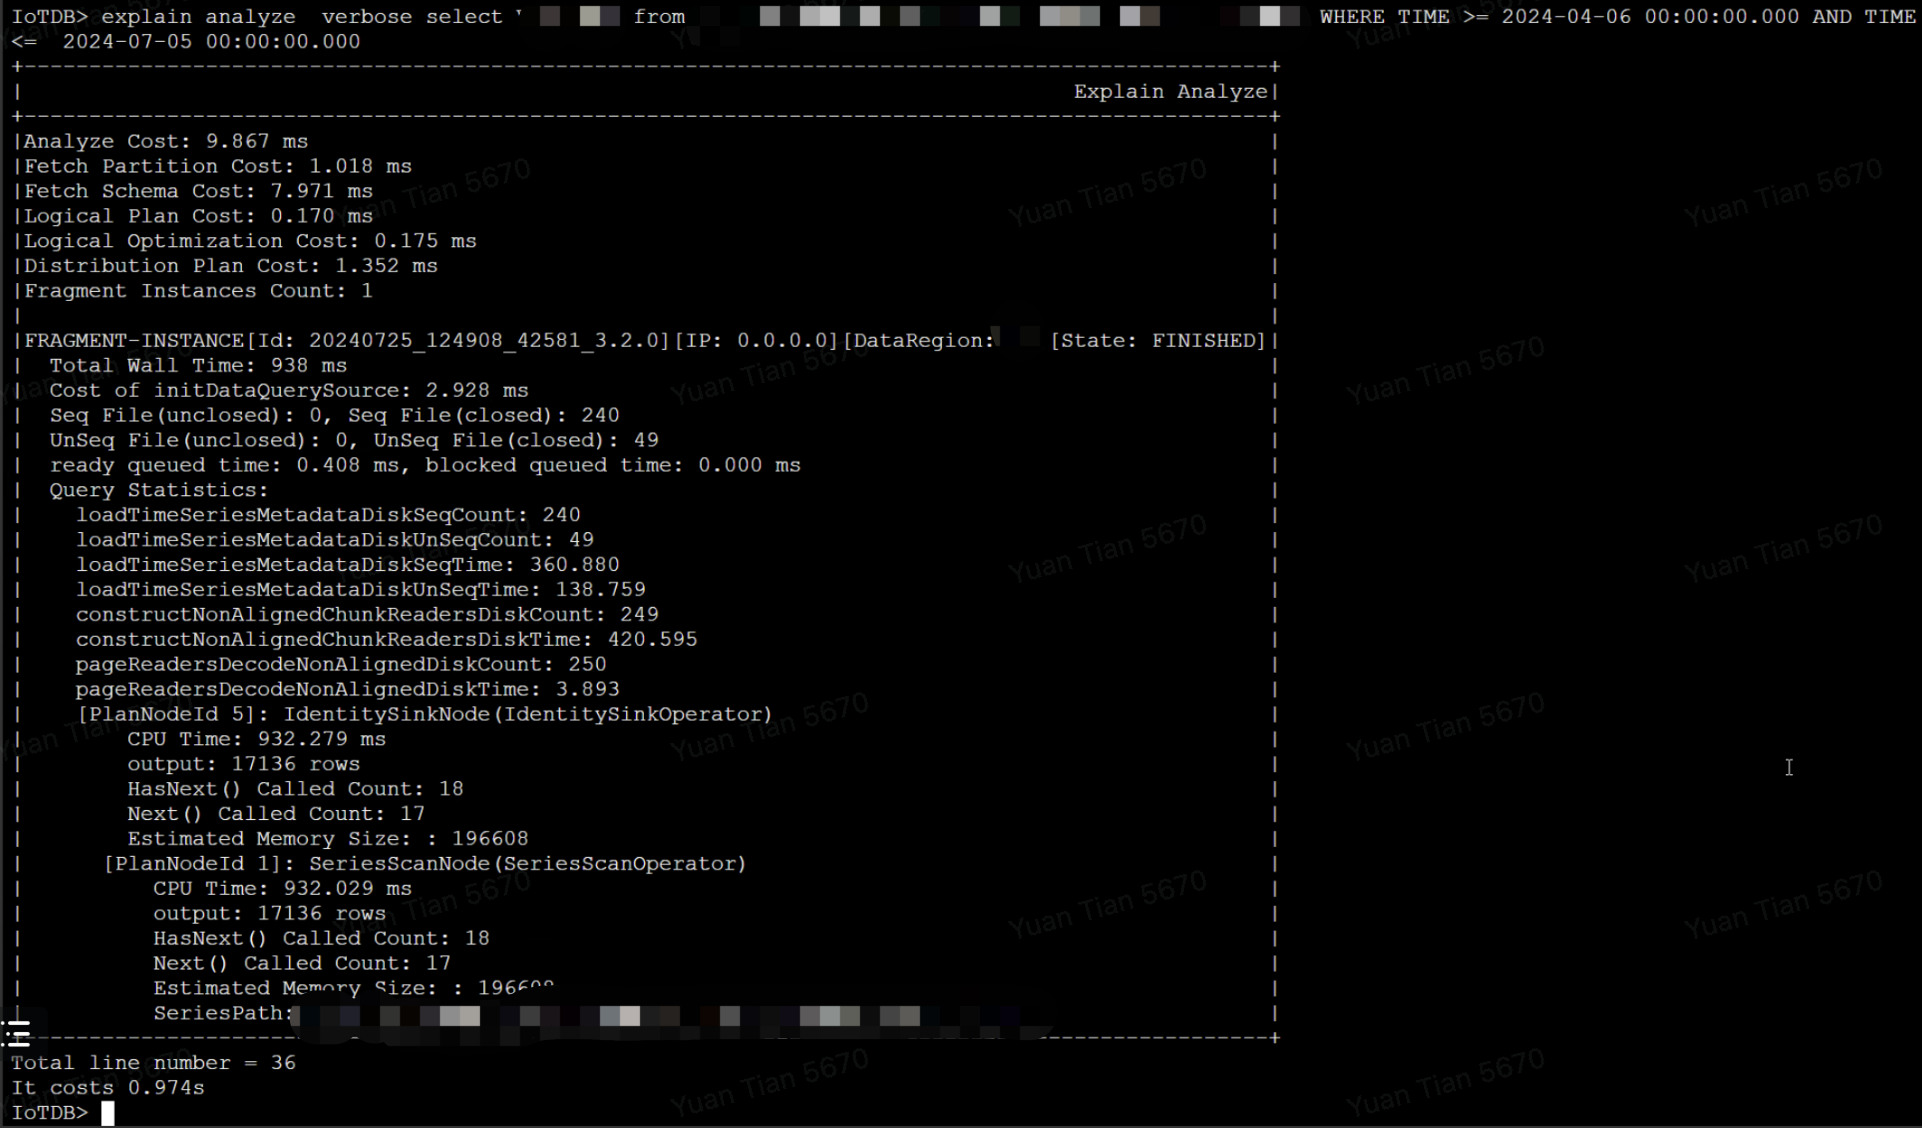
The total query time is 938 ms, of which the time to read the index area and data area from the files accounts for 918 ms, involving a total of 289 files. Assuming the query involves N TsFiles, the theoretical time for the first query (not hitting the cache) is cost = N * (t_seek + t_index + t_seek + t_chunk). Based on experience, the time for a single seek on an HDD disk is about 5-10ms, so the more files involved in the query, the greater the query delay will be.
The final optimization plan is:
Adjust the merge parameters to reduce the number of files
Replace HDD with SSD to reduce the latency of a single disk IO
Case Study 2: The execution of the like predicate is slow, causing the query to time out
When executing the following SQL, the query times out (the default timeout is 60 seconds)
select count(s1) as total from root.db.d1 where s1 like '%XXXXXXXX%'When executing explain analyze verbose, even if the query times out, the intermediate collection results will be output to log_explain_analyze.log every 15 seconds. The last two outputs obtained from log_explain_analyze.log are as follows:
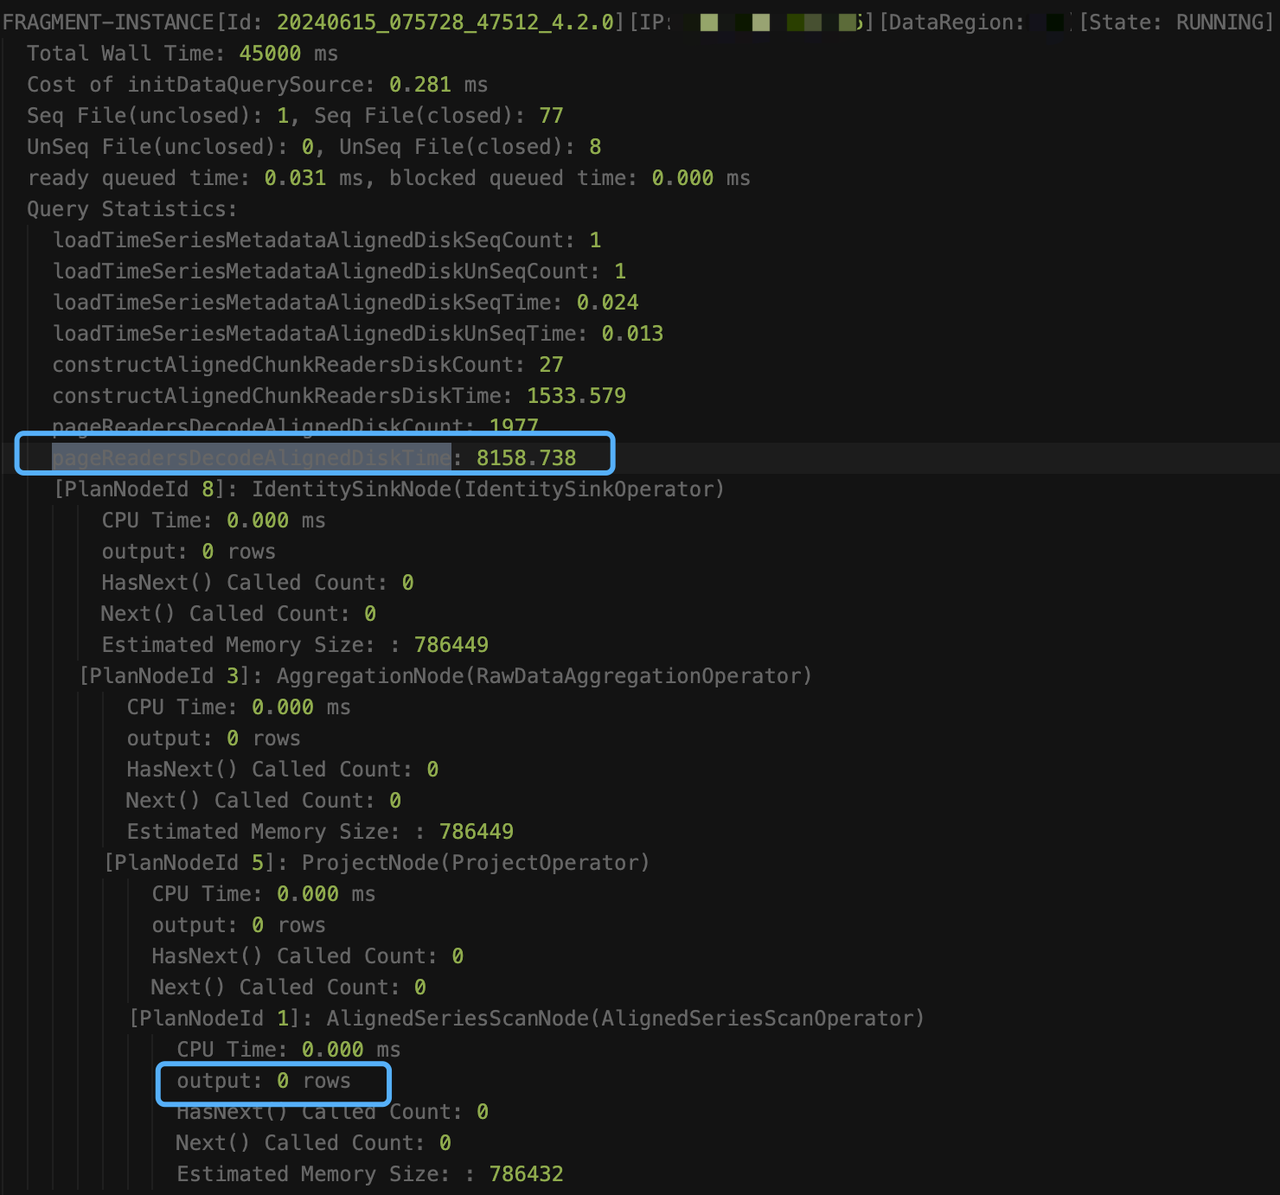
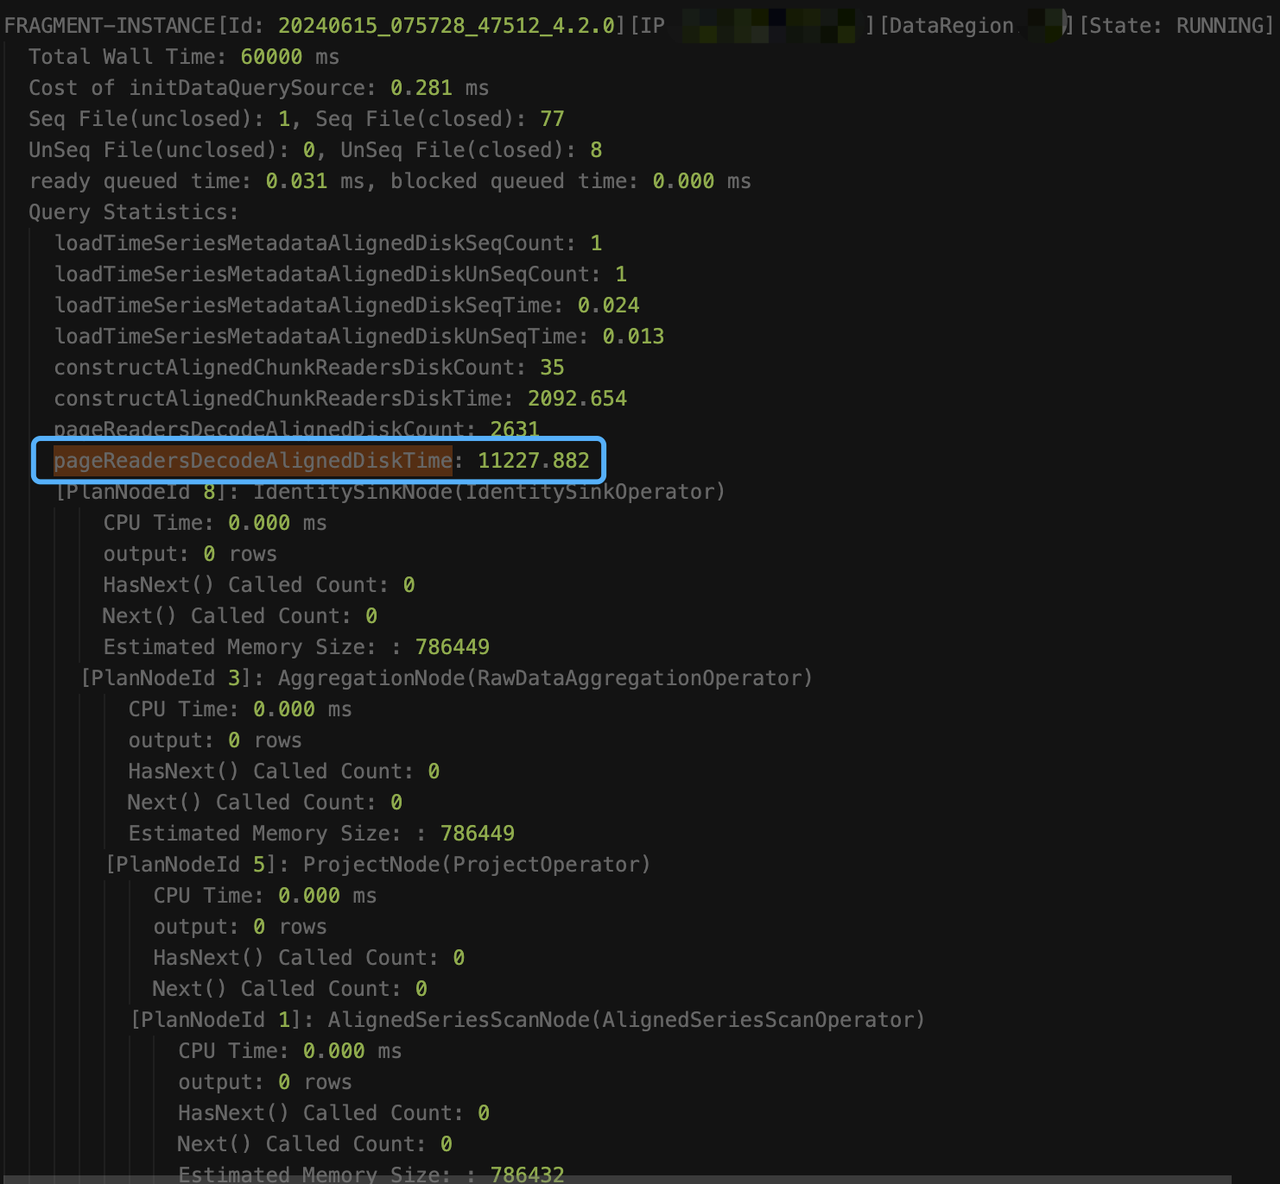
Observing the results, we found that it is because the query did not add a time condition, involving too much data, and the time of constructAlignedChunkReadersDiskTime and pageReadersDecodeAlignedDiskTime has been increasing, which means that new chunks are being read all the time. However, the output information of AlignedSeriesScanNode has always been 0, because the operator only gives up the time slice and updates the information when at least one line of data that meets the condition is output. Looking at the total reading time (loadTimeSeriesMetadataAlignedDiskSeqTime + loadTimeSeriesMetadataAlignedDiskUnSeqTime + constructAlignedChunkReadersDiskTime + pageReadersDecodeAlignedDiskTime = about 13.4 seconds), the other time (60s - 13.4 = 46.6) should all be spent on executing the filtering condition (the execution of the like predicate is very time-consuming).
The final optimization plan is: Add a time filtering condition to avoid a full table scan.
Region Migration
The Region migration feature has operating costs. It is recommended to read this section completely before using this feature. If you have any questions about the solution design, please contact the IoTDB team for technical support.
Feature introduction
IoTDB is a distributed database. The balanced distribution of data plays an important role in the load balance of disk space and write pressure in the cluster. Region is the basic unit for distributed storage of data in IoTDB cluster. Specific concept can be seen in region.
In cluster normal operation, IoTDB kernel will automatically load balance the data, but in the cluster new join DataNode node, DataNode where the machine hard disk damage needs to recover data and other scenarios, will involve the region of manual migration, in order to achieve more fine adjustment of the cluster load goal.
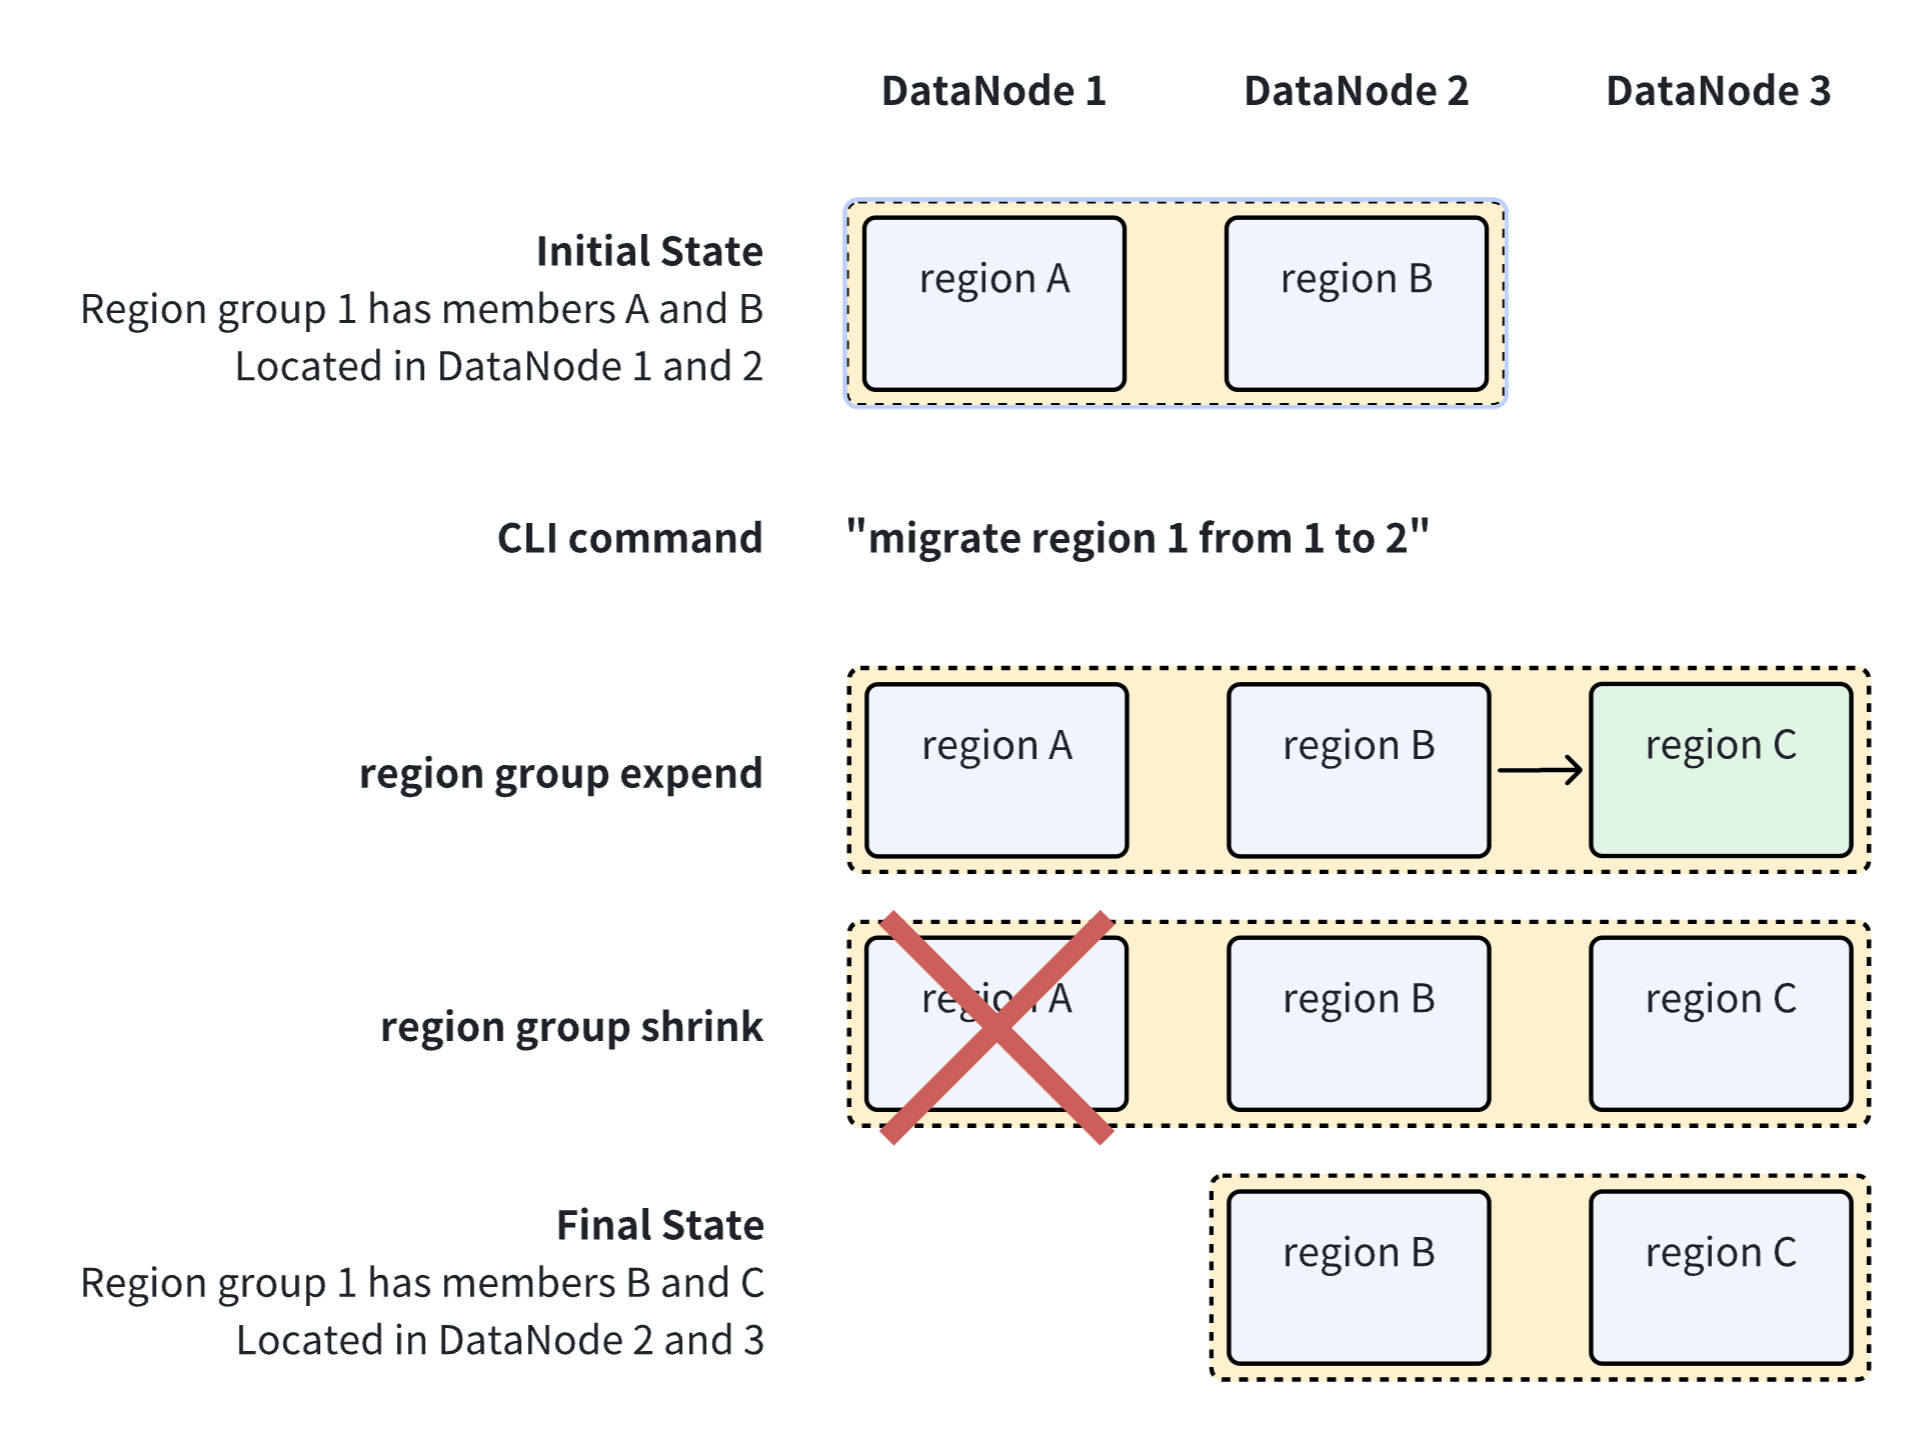
Here is a schematic diagram of the region migration process :
Notes
- Region migration is supported only 1.3.3 IoTDB and later.
- IoTConsensus and Ratis protocols (
schema_region_consensus_protocol_classanddata_region_consensus_protocol_classiniotdb-system.properties) are currently supported . - Region migration requires system resources such as hard disk and internet bandwidth, and although the process does not block reads and writes , it may affect read and write speeds .
- The region migration process will block the deletion of the WAL file of this consensus group. If the total number of WAL files reaches
wal_file_size_threshold_in_byte, it will block writing.
Instructions for use
Grammar definition :
  migrateRegion
      : MIGRATE REGION regionId=INTEGER_LITERAL FROM fromId=INTEGER_LITERAL TO toId=INTEGER_LITERAL
      ;
Meaning : Migrates a region from one DataNode to another.
Example : Migrating region 1 from DataNode 2 to DataNode 3:
  IoTDB> migrate region 1 from 2 to 3
  Msg: The statement is executed successfully.
"The statement is executed successfully" only represents the successful submission of the region migration task, not the completion of execution. The execution status of the task can be viewed through the CLI command
show regions.Related configuration :
- Migration speed control : modify
iotdb-system.propertiesparametersregion_migration_speed_limit_bytes_per_secondcontrol region migration speed.
- Migration speed control : modify
Time cost estimation :
- If there are no concurrent writes during the migration process, the time consumption can be simply estimated by dividing the region data volume by the data transfer speed. For example, for a 1TB region, the hard disk internet bandwidth and speed limit parameters jointly determine that the data transfer speed is 100MB/s, so it takes about 3 hours to complete the migration.
- If there are concurrent writes in the migration process, the time consumption will increase, and the specific time consumption depends on various factors such as write pressure and system resources. It can be simply estimated as
no concurrent write time × 1.5.
Migration progress observation : During the migration process, the state changes can be observed through the CLI command
show regions. Taking the 2 replicas as an example, the state of the consensus group where the region is located will go through the following process:- Before migration starts:
Running,Running. - Expansion phase:
Running,Running,Adding. Due to the large number of file transfers involved, it may take a long time. If using IoTConsensus, the specific file transfer progress can be searched in the DataNode log[SNAPSHOT TRANSMISSION]. - Stages:
Removing,Running,Running. - Migration complete:
Running,Running.
Taking the expansion phase as an example, the result of
show regionsmay be:IoTDB> show regions +--------+------------+-------+--------+-------------+-----------+----------+----------+-------+---------------+--------+-----------------------+ |RegionId| Type| Status|Database|SeriesSlotNum|TimeSlotNum|DataNodeId|RpcAddress|RpcPort|InternalAddress| Role| CreateTime| +--------+------------+-------+--------+-------------+-----------+----------+----------+-------+---------------+--------+-----------------------+ | 0|SchemaRegion|Running| root.ln| 1| 0| 1| 0.0.0.0| 6668| 127.0.0.1| Leader|2024-04-15T18:55:17.691| | 0|SchemaRegion|Running| root.ln| 1| 0| 2| 0.0.0.0| 6668| 127.0.0.1| Leader|2024-04-15T18:55:17.691| | 0|SchemaRegion|Running| root.ln| 1| 0| 3| 0.0.0.0| 6668| 127.0.0.1| Leader|2024-04-15T18:55:17.691| | 1| DataRegion|Running| root.ln| 1| 1| 1| 0.0.0.0| 6667| 127.0.0.1| Leader|2024-04-15T18:55:19.457| | 1| DataRegion|Running| root.ln| 1| 1| 2| 0.0.0.0| 6668| 127.0.0.1|Follower|2024-04-15T18:55:19.457| | 1| DataRegion| Adding| root.ln| 1| 1| 3| 0.0.0.0| 6668| 127.0.0.1|Follower|2024-04-15T18:55:19.457| +--------+------------+-------+--------+-------------+-----------+----------+----------+-------+---------------+--------+-----------------------+ Total line number = 3 It costs 0.003s- Before migration starts:
Start/Stop Repair Data Statements
Used to repair the unsorted data generate by system bug.
START REPAIR DATA
Start a repair task to scan all files created before current time. The repair task will scan all tsfiles and repair some bad files.
IoTDB> START REPAIR DATA
IoTDB> START REPAIR DATA ON LOCAL
IoTDB> START REPAIR DATA ON CLUSTER
STOP REPAIR DATA
Stop the running repair task. To restart the stopped task. If there is a stopped repair task, it can be restart and recover the repair progress by executing SQL START REPAIR DATA.
IoTDB> STOP REPAIR DATA
IoTDB> STOP REPAIR DATA ON LOCAL
IoTDB> STOP REPAIR DATA ON CLUSTER