
Telegraf Plugin
Telegraf Plugin
1. Product Overview
1.1 Telegraf
Telegraf is an open-source agent designed for collecting, processing, and transmitting metrics and telemetry data, developed by InfluxData.
Telegraf offers the following key features:
- Plugin Architecture: Telegraf’s power lies in its extensive plugin ecosystem. It supports a wide range of input, output, and processor plugins, seamlessly integrating with various data sources and destinations.
- Data Collection: Telegraf excels at gathering metrics from diverse sources, such as system metrics, logs, databases, and more. Its versatility makes it ideal for monitoring applications, infrastructure, and IoT devices.
- Output Destinations: Once collected, data can be routed to multiple output destinations, including popular databases like InfluxDB. This flexibility allows Telegraf to adapt to diverse monitoring and analytics setups.
- Simple Configuration: Telegraf configurations are managed via TOML files. This simplicity enables users to easily define inputs, outputs, and processors, streamlining customization.
- Community & Support: As an open-source project, Telegraf benefits from an active community. Users can contribute plugins, report issues, and seek assistance through forums and documentation.
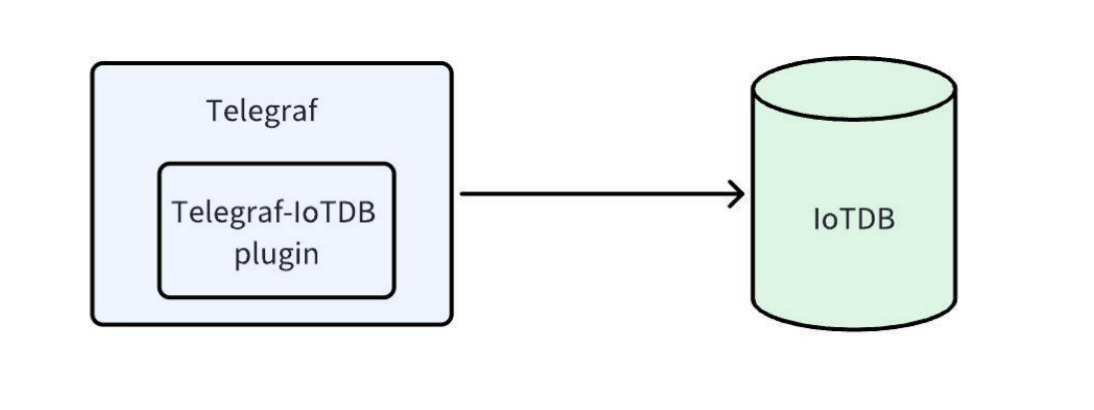
1.2 Telegraf-IoTDB Plugin
The Telegraf-IoTDB plugin enables exporting monitoring data stored in Telegraf to IoTDB. This output plugin connects and writes data using the IoTDB session interface.
2. Installation Requirements
Telegraf supports multiple operating systems, including Linux, Windows, and macOS. To ensure successful installation, it is recommended to run Telegraf with administrator (root) privileges. For detailed requirements, refer to Installation Requirements.
3. Installation Steps
For specific installation instructions, see Installation Steps.
- Note: This plugin is a built-in plugin of Telegraf and requires no additional installation.
4. Usage Guide
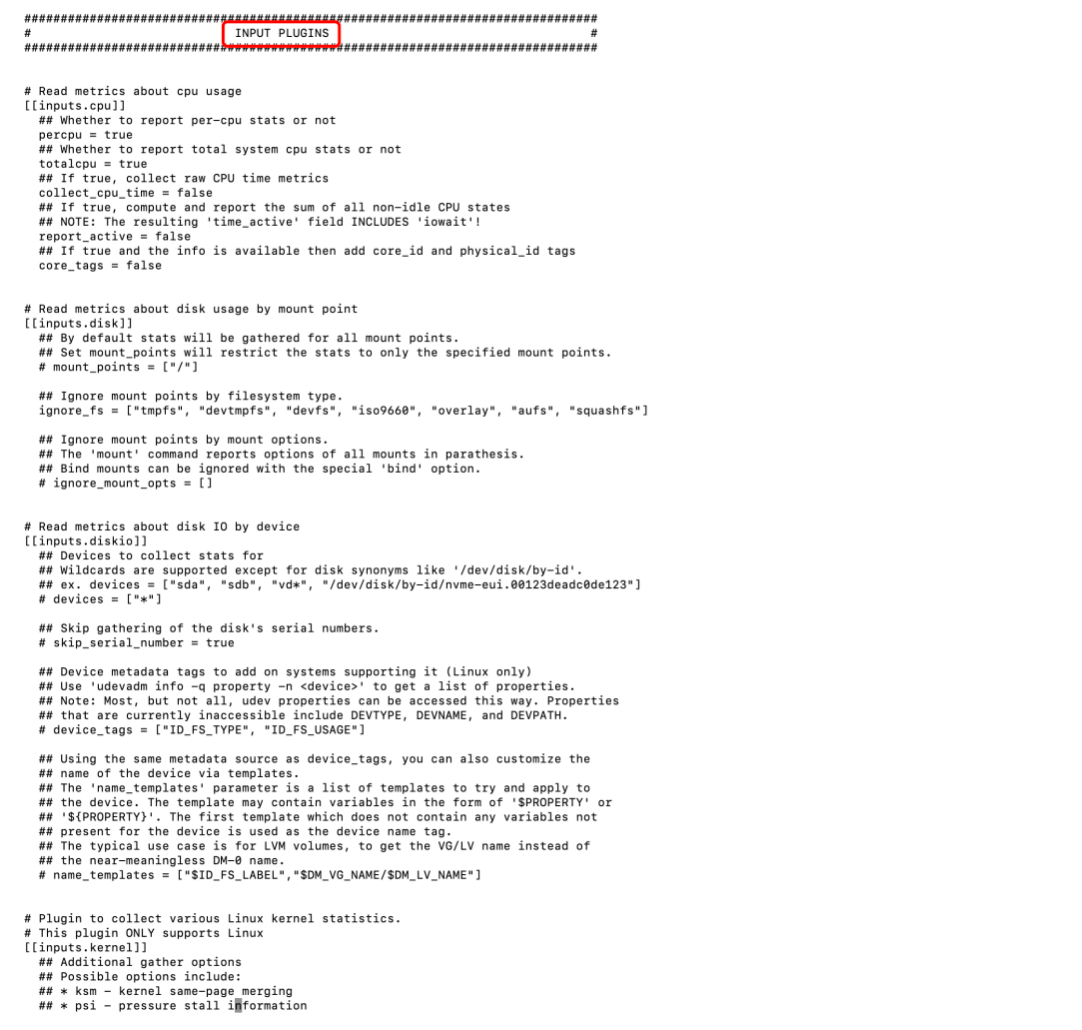
4.1 Configuring Input Sources
In the telegraf.conf configuration file, locate the INPUT PLUGINS section to define input sources. Key configuration parameters are listed below:
| Parameter | Description | Notes |
|---|---|---|
| alias | Name the plugin instance. | |
| interval | Frequency for collecting metrics. Adjust this to reduce data rate limits. | Default plugins use a global interval; override here for specific inputs. |
| precision | Override the agent’s precision setting. Metrics are rounded to this value. | When set for a service input (e.g., statsd), the database may merge events with identical timestamps. |
| collection_jitter | Override the agent’s collection_jitter setting. Adds randomness to intervals. | Helps stagger data collection across multiple inputs. |
| name_override | Custom time series path name for output to IoTDB. | The path name must comply with the syntax rules. |
| name_prefix | Prefix appended to the measurement name. | |
| name_suffix | Suffix appended to the measurement name. |
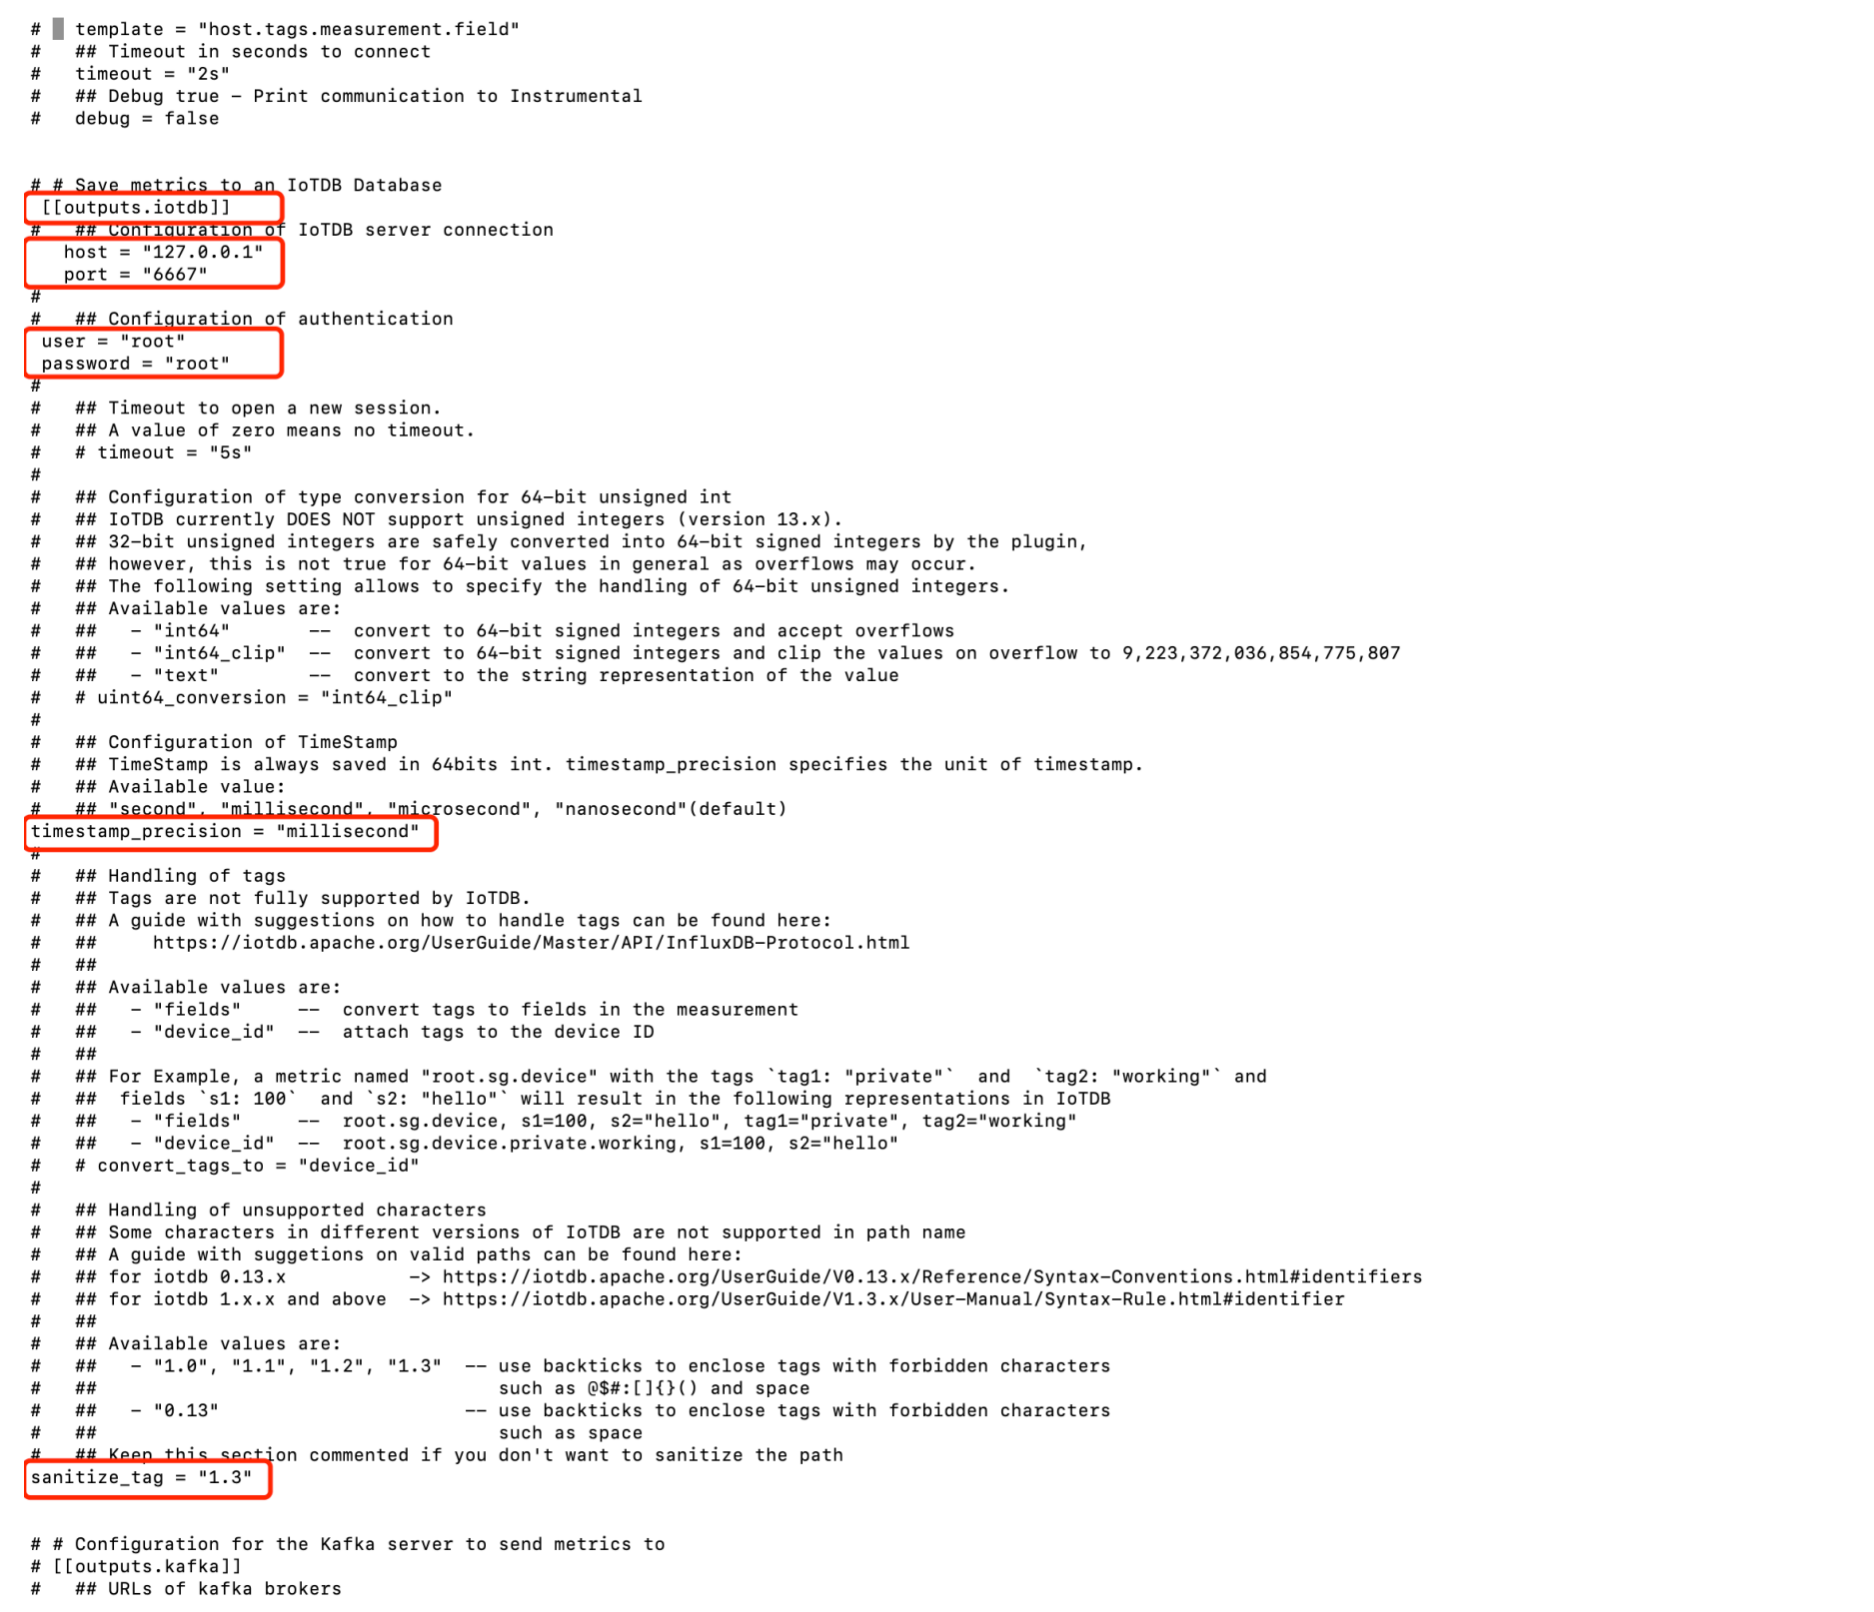
4.2 Configure Output Source
Find the outputs.iotdb section in the telegraf.conf configuration file to configure the output source. Specific configuration items are shown in the following table. For configuration examples, refer to the Output Source Examples.
| Configuration Item | Description | Before Modification | After Modification | Notes |
|---|---|---|---|---|
| host | IoTDB host address | # host = "127.0.0.1" | host = "deployment host of IoTDB" | Default: 127.0.0.1 |
| port | IoTDB port number | # port = "6667" | port = "deployment port of IoTDB" | Default: 6667 |
| user | IoTDB username | # user = "root" | user = "IoTDB username" | Default: root |
| password | IoTDB password | # password = "root" | password = "IoTDB password" | Default: root |
| timestamp_precision | Timestamp precision | timestamp_precision = "millisecond" | timestamp_precision = "same timestamp precision as IoTDB" | Check "timestamp_precision" field in "iotdb-system.properties" |
| sanitize_tag | Database version compatibility | N/A | sanitize_tag = "0.13/1.0/1.1/1.2/1.3" | Configure according to the actual IoTDB version |
4.3 Start Telegraf Service
telegraf -config /path/to/telegraf.conf5. Usage Example
The following example demonstrates how to use Telegraf to collect CPU metrics and output them to IoTDB using the Telegraf-IoTDB plugin.
- Generate a Configuration File
Use the telegraf command to generate a sample configuration file for CPU input and IoTDB output:
telegraf --sample-config --input-filter cpu --output-filter iotdb > cpu_iotdb.conf- Modify the Input Plugin Configuration
In the cpu_iotdb.conf file, locate the [[inputs.cpu]] section and configure it as follows. The name_override field defines the custom time series path in IoTDB:
# Read metrics about cpu usage
[[inputs.cpu]]
  ## Whether to report per-cpu stats or not
  percpu = true
  ## Whether to report total system cpu stats or not
  totalcpu = true
  ## If true, collect raw CPU time metrics
  collect_cpu_time = false
  ## If true, compute and report the sum of all non-idle CPU states
  report_active = false
  ## If true and the info is available then add core_id and physical_id tags
  core_tags = false
name_override = "root.demo.telgraf.cpu"- Configure the IoTDB Output Plugin
Locate the [[outputs.iotdb]] section in cpu_iotdb.conf and modify the settings as shown below. Ensure alignment with your IoTDB deployment parameters.
| Configuration Item | Description | Before Modification | After Modification | Notes |
|---|---|---|---|---|
| host | IoTDB host address | # host = "127.0.0.1" | host = "your_iotdb_host" | Default: 127.0.0.1 |
| port | IoTDB port number | # port = "6667" | port = "your_iotdb_port" | Default: 6667 |
| user | IoTDB username | # user = "root" | user = "your_iotdb_username" | Default: root |
| password | IoTDB password | # password = "root" | password = "your_iotdb_password" | Default: root |
| timestamp_precision | Timestamp precision | timestamp_precision = "millisecond" | timestamp_precision = "same_as_iotdb" | Match the timestamp_precision in iotdb-system.properties |
| sanitize_tag | Database version compatibility | Not present | sanitize_tag = "0.13/1.0/1.1/1.2/1.3" | Configure based on your IoTDB version |
# Save metrics to an IoTDB Database
[[outputs.iotdb]]
  ## Configuration of IoTDB server connection
  host = "127.0.0.1"
  # port = "6667"

  ## Configuration of authentication
  # user = "root"
  # password = "root"

  ## Timeout to open a new session.
  ## A value of zero means no timeout.
  # timeout = "5s"

  ## Configuration of type conversion for 64-bit unsigned int
  ## IoTDB currently DOES NOT support unsigned integers (version 13.x).
  ## 32-bit unsigned integers are safely converted into 64-bit signed integers by the plugin,
  ## however, this is not true for 64-bit values in general as overflows may occur.
  ## The following setting allows to specify the handling of 64-bit unsigned integers.
  ## Available values are:
  ##   - "int64"       --  convert to 64-bit signed integers and accept overflows
  ##   - "int64_clip"  --  convert to 64-bit signed integers and clip the values on overflow to 9,223,372,036,854,775,807
  ##   - "text"        --  convert to the string representation of the value
  # uint64_conversion = "int64_clip"

  ## Configuration of TimeStamp
  ## TimeStamp is always saved in 64bits int. timestamp_precision specifies the unit of timestamp.
  ## Available value:
  ## "second", "millisecond", "microsecond", "nanosecond"(default)
  timestamp_precision = "millisecond"

  ## Handling of tags
  ## Tags are not fully supported by IoTDB.
  ## A guide with suggestions on how to handle tags can be found here:
  ##     https://iotdb.apache.org/UserGuide/Master/API/InfluxDB-Protocol.html
  ##
  ## Available values are:
  ##   - "fields"     --  convert tags to fields in the measurement
  ##   - "device_id"  --  attach tags to the device ID
  ##
  ## For Example, a metric named "root.sg.device" with the tags `tag1: "private"`  and  `tag2: "working"` and
  ##  fields `s1: 100`  and `s2: "hello"` will result in the following representations in IoTDB
  ##   - "fields"     --  root.sg.device, s1=100, s2="hello", tag1="private", tag2="working"
  ##   - "device_id"  --  root.sg.device.private.working, s1=100, s2="hello"
  # convert_tags_to = "device_id"
   ## Handling of unsupported characters
  ## Some characters in different versions of IoTDB are not supported in path name
  ## A guide with suggetions on valid paths can be found here:
  ## for iotdb 0.13.x           -> https://iotdb.apache.org/UserGuide/V0.13.x/Reference/Syntax-Conventions.html#identifiers
  ## for iotdb 1.x.x and above  -> https://iotdb.apache.org/UserGuide/V1.3.x/User-Manual/Syntax-Rule.html#identifier
  ##
  ## Available values are:
  ##   - "1.0", "1.1", "1.2", "1.3"  -- enclose in `` the world having forbidden character
  ##                                    such as @ $ # : [ ] { } ( ) space
  ##   - "0.13"                      -- enclose in `` the world having forbidden character
  ##                                    such as space
  ##
  ## Keep this section commented if you don't want to sanitize the path
sanitize_tag = "1.3"- Run Telegraf with the Configuration File
Start Telegraf using the cpu_iotdb.conf file.
After running Telegraf for a period of time, you can query the collected CPU metrics in IoTDB. Use IoTDB’s CLI or REST API to verify the data.