

In a production environment, consistently optimizing system performance is crucial, yet challenging. Sometimes query latency has increased while recent optimizations that improved write performance. This raises some frequently asked questions: how can I effectively diagnose and address performance issues? How to monitor resource usage and pinpoint whether issues stem from CPU, disk, or memory constraints, etc.?
The aforementioned scenario is familiar to many in software engineering and system architecture. Understanding the state of the system during performance issues is critical for forming effective response strategies. Rapidly identifying system bottlenecks is a common challenge, and it is essential to monitor the performance and coordination of different system modules.
In the upcoming articles of the Monitoring in Apache IoTDB series, we will share solutions to these issues.
Observability in Distributed Systems
With the rise of distributed architectures, the concept of observability has gained prominence. Originating from control theory, introduced by Hungarian mathematician Rudolf E. Kálmán [1], observability refers to the degree to which one can infer a system's internal state from its external outputs. Its principles have been practiced for years after the import from control theory to computer science.
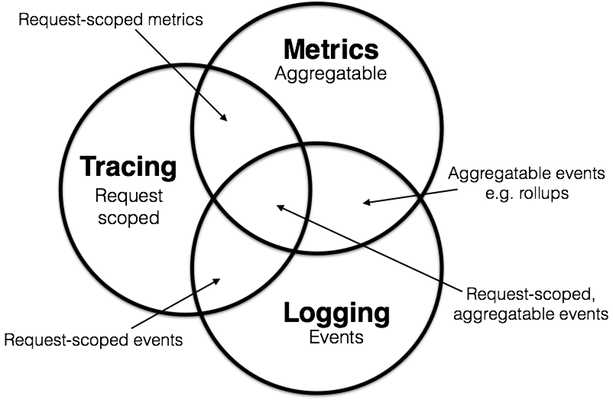
Observability typically breaks down into three main components: event logs, tracing, and metrics.[2][3][4] These components, while distinct, often overlap and complement each other. In 2017, Peter Bourgon’s article "Metrics, Tracing, and Logging" from the Distributed Tracing Summit provided a comprehensive explanation of these elements, garnering widespread industry recognition.[5]
Monitoring with Apache IoTDB
In distributed environments, relying solely on event logs for system monitoring is inefficient. Tracing and aggregated metrics offer more effective alternatives. Since Apache IoTDB version 1.0.0, the system has included a monitoring module designed for distributed architectures.[6] This module establishes a framework for monitoring, defining, managing, and collecting system metrics. It allows for the seamless addition of new metrics during development and centralizes their management.
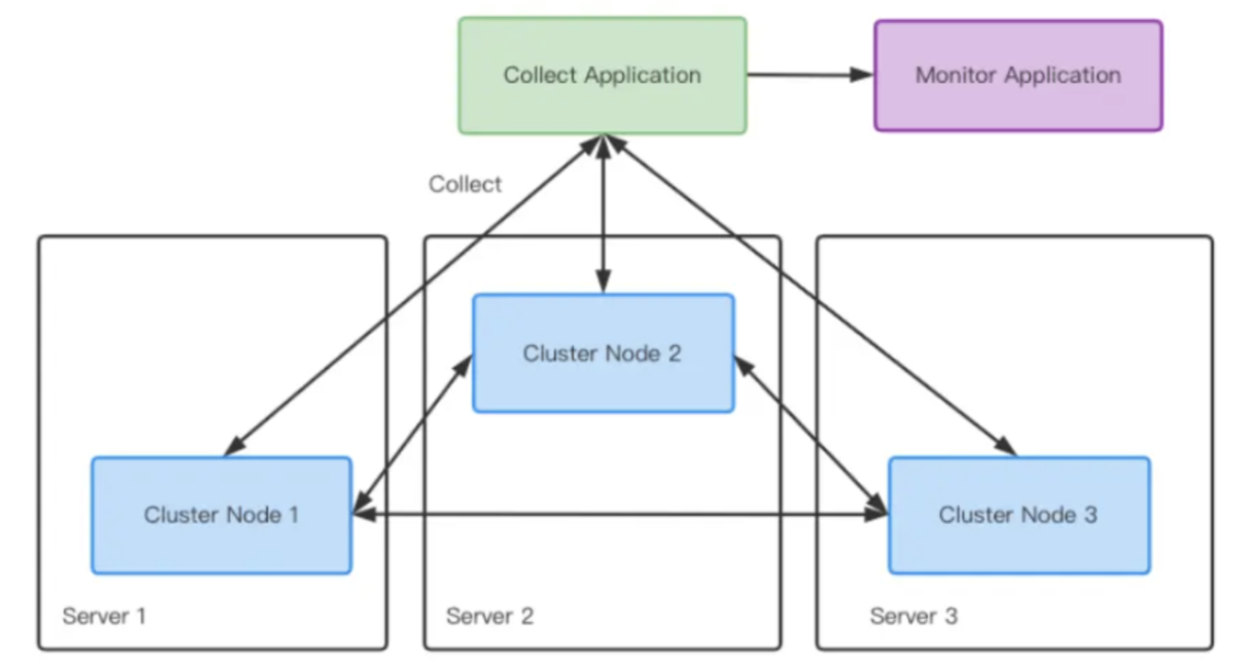
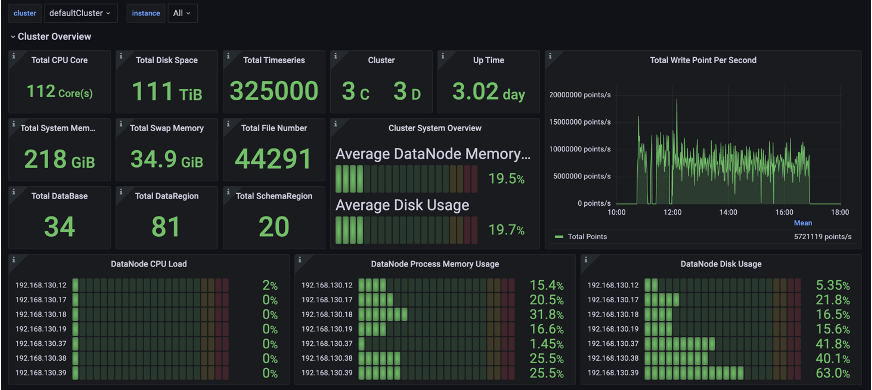
Apache IoTDB leverages Prometheus and Grafana for metric collection and visualization. This setup integrates top-down load perspectives with bottom-up resource views, enabling comprehensive cluster state monitoring. It supports bottleneck identification, performance tuning, and issue resolution. With thousands of monitoring metrics available, the impact on IoTDB's performance decrease remains less than 5%, making it highly recommended for efficient operation.
Conclusion
This article introduces some basic concepts of observability and monitoring in Apache IoTDB. We will delve into specific monitoring metrics and their applications in resolving performance issues and troubleshooting in the following Monitoring in Apache IoTDB series.
Join us in exploring the capabilities and stories of Apache IoTDB and its monitoring tools. Stay tuned for more insights!
References
[1] R.E. Kalman. On the general theory of control systems.
[2] Benjamin H. Sigelman. Dapper, a Large-Scale Distributed Systems Tracing Infrastructure
[3] Jay Livens. What is observability? Not just logs, metrics and traces
[4] Cindy Sridharan. Chapter 4. The Three Pillars of Observability
[5] Peter Bourgon. Metrics, tracing, and logging


